Bounty PHIToken
MONTECARLO Simulation on Bitcoin price
written by Daniele Bernardi, CEO at PHIToken
I had fun making some MonteCarlo Simulations (which I spoke about extensively in my italian post How to create a MonteCarlo simulation in Excel) to the historical series of Bitcoin.
DECLARATION
After Bill Gates’s assertions predicting that the price of Bitcoin will reach 500,000 Dollars, I tried to understand how this innovative investment asset might develop by using classical models common in the world of traditional finance.
First of all, it is necessary to establish the two parameters necessary to conduct a MonteCarlo simulation, namely volatility and average returns.
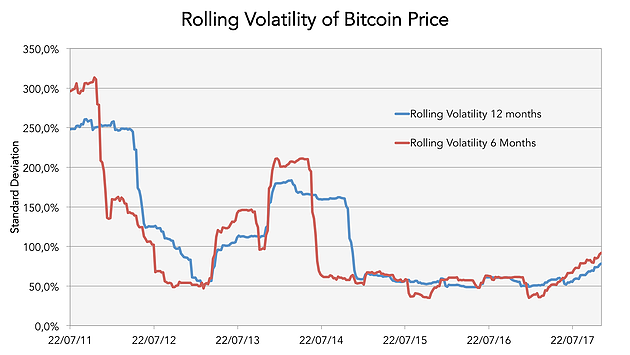
As you can see the rolling volatility is very variable and the average probably not significant because it would be influenced by the early years of Bitcoin’s existence in which volatility was more than 300%.
HOW YOU CAN READ IT
The graph is obtained by measuring the volatility of twelve months (blue line) which then shifts from week to week, thus determining the trend of the so-called “Rolling” volatility and the same for the red line, which instead is the volatility at six months.
For those who understand the financial historical series, to have a high return a high volatility is necessary and Bitcoin is the ultimate prince in this, perhaps also the king of the historical series with high returns.
HISTORICAL RETURN
To use the average return I took into account the line of the exponential graph (which would actually be a line that exponentially grows on a linear graph (as explained in the post Differences between linear and logarithmic graphs).
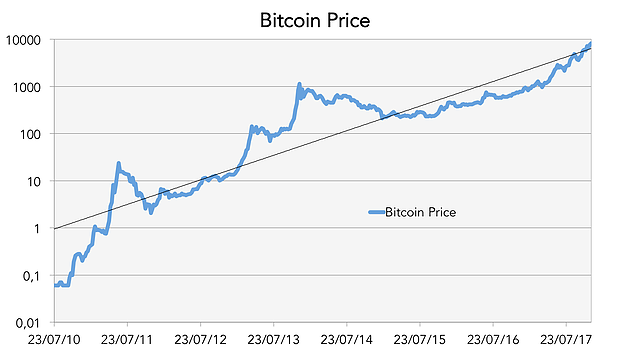
This straight line, which practical is the DIAMAN Ratio of the historical series of Bitcoin indicates that the average annual long-term returns will be an incredible +162%.
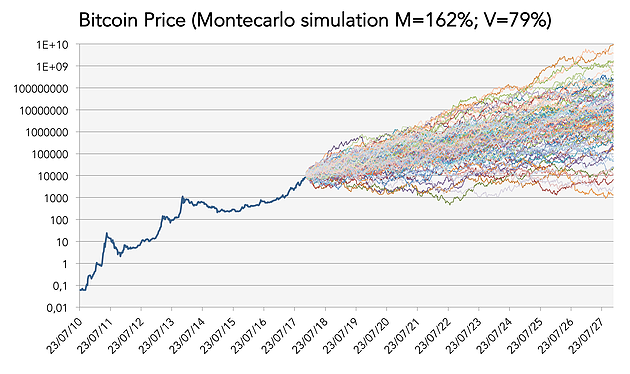
Taking the current value of volatility at 12 months or 79%, and the average return +162%, we can conduct Montecarlo simulations (we have done 10,000 but we only mention 100 to enable the graph to be read in better) to understand how the price of Bitcoin could develop in the coming months and years.
THE MILLION DOLLAR QUESTION:
But is such a trend sustainable in the long run?
Honestly, it is difficult to imagine, even if that is the intention of the Bitcoin creators and in the logic of scarcity theoretically, the price of Bitcoin could exceed the 500,000 Dollars predicted by Bill Gates.
OBSERVATIONS
Whether it was in the plans of those who created Bitcoin, whether it is actually the elusive Satoshi Nakamoto or behind the pseudonym which he uses to mask a research team, you can guess from the fact that they predicted eight decimals after the decimal point, that is the price of Bitcoin could reach, as it is structured, mind you, the stratospheric value of 100.000.000.000 dollars or one hundred million dollars.
ASSUMPTIONS
In the most exciting of the assumptions, that is to say in the most “lucky” simulation of the thousand made, this expected return and this volatility could be achieved as early as 2024.
We are talking about simulations and assumptions, obviously, which should be supported by an almost absolute expansion of Bitcoin as a global payment system, difficult to imagine objectively, but still possible from a computational and probabilistic point of view.
PROBABILITY’
Looking at the numbers we could say that there is about 2% chance that Bitcoin will reach the ridiculous price of 100 million dollars by 2025.
In order for this montecarlo simulation to make sense, it is necessary to assume a growth in the number of users constantly exponential, as explained in the post How we can better understand what “Financial Bubble” means.
FOLLOWING-UP
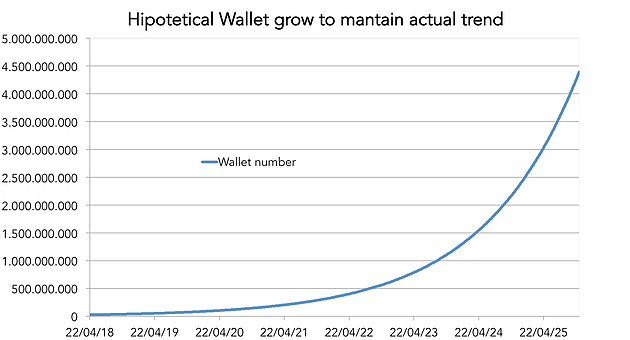
I have therefore increased the exponential growth line of the number of wallets in circulation to date, with an average growth rate of 1.3% per month (the rate of the last three years).
To assert that the MonteCarlo simulation with Media=162% and Volatility=79% makes sense in the long run, it is, therefore, necessary to say that in 2025 there will have to be 4.5 billion Wallet (something honestly difficult to imagine).
OTHER ASSUMPTIONS
At this point, I thought it would be more appropriate to reduce the average annual growth over time and therefore I made two further simulations, the first assuming a miserable annual return of 15% (slightly higher than the historical stock S&P500) but maintaining arbitrarily volatility at 79% and the resulting graph is as follows:
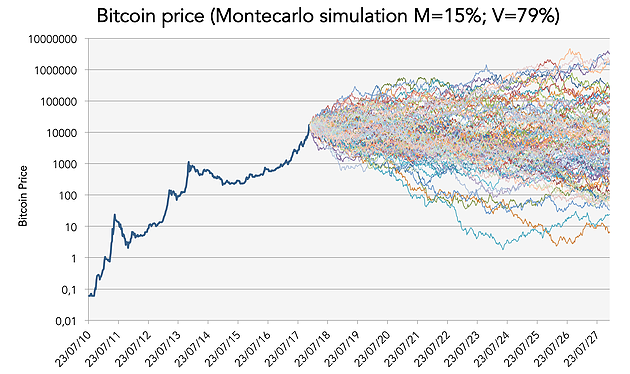
As you can see, with such high volatility it can happen, to make the detractors of cryptocurrencies happy that Bitcoin (although with an equally low probability compared to the previous example of 100 million) could return to the value of 10 miserable dollars, but to tell the truth the average of the results at 10 years, with a modest average return but a high volatility is however higher than 110,000 dollars.
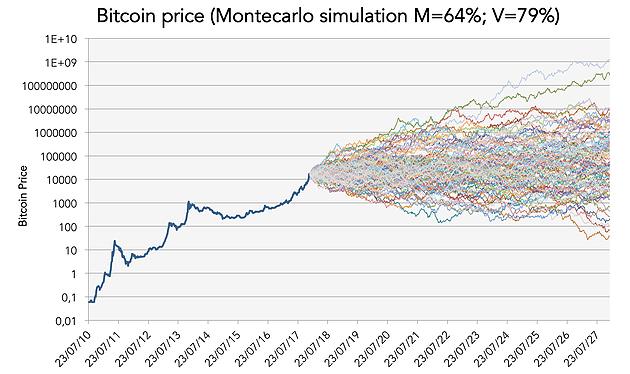
As always in an arbitrary manner, I tried to make a MonteCarlo simulation of 10.000 assumptions with an average return much lower than the current but adequate to the very high volatility that characterizes Bitcoin; Chosen arbitrarily as always (there was a reason but having made these simulations three weeks ago I don’t remember anymore, forgive me) to use an average annual return of 64% and a volatility of 79%.
SUSTAINABLE SHARPE
Why this choice, you will ask yourself, because I’m curious and I hope you too, to see where the Bitcoin price could go with a Sharpe ratio lower than 1, so all in all plausible.
In this assumptions there were no cases where the value dropped to 10 Dollars in any of the 10.000 simulations.
AS INDICATED
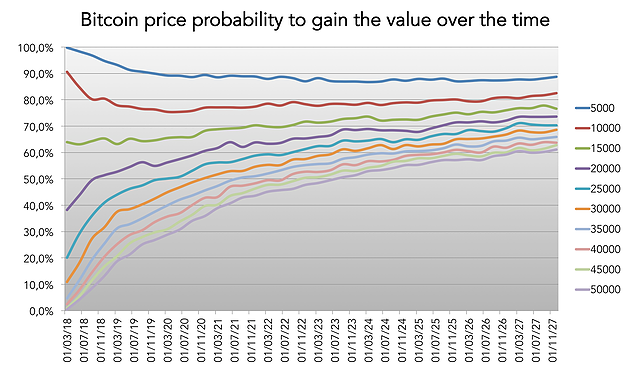
From this simulation is it possible to extract the possibility that the price of Bitcoin price is above a certain value or for example, what is the probability that the price of Bitcoin price will be above 5.000 in July 2018? From the graph we can deduce 98%, while reading it in the opposite way means that today we have about two percent chance that in June the price of Bitcoin will be below 5.000 Dollars.
FAVORABLE
To avoid being blamed for bringing misfortune, on the contrary, what is the possibility that the price of Bitcoin price will be higher than 50.000 dollars in July 2018? From the MonteCarlo simulation, 4.2% of random assumptions with the characteristics described above will have a value of more than 50.000 dollars in July 2018.
But what is interesting is that there is a 50% probability that the price will rise above 50000 dollars by September 2023.
DON’T CONSIDER WHAT I SAY TO BE A FORGONE CONCLUSION
Obviously, data is obtained through random simulations that must be considered with the benefit of doubt, but it is useful to understand the dynamics, potentialities and risks that this innovative financial instrument offer (which in my opinion must be considered an asset class to have in the portfolio, in “homeopathic” quantities of course).
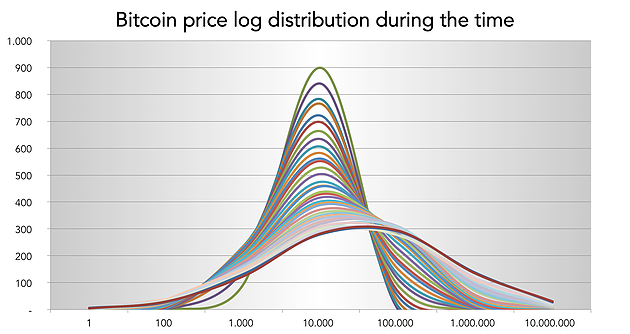
INNOVATIVE GRAPH
Last but not least, I can explain only the opening chart of the Blog: the MonteCarlo simulations at each quarter offer a distribution of the returns derived from the simulation itself; to correctly describe them as gaussian, it is necessary to use an exponential scale in the abscissa axis because the resulting distribution is obviously strongly influenced by the high average returns over the years that make the capitalization effect of the exponential returns precisely.
I hope you liked this post and if that is the case, share it in social networks so you can help me make it circulate.
For those who want to download the excel file, you can do so by clicking here: Simulation-Montecarlo-for-Bitcoin. xlsx
Bitcointalk:https://bitcointalk.org/index.php?action=profile;u=1582803;sa=forumProfile
My name:kabel


Komentar
Posting Komentar